Soil Mechanics – Soil Compaction
Compaction, OMC, Proctor Tests, Field Methods and Compaction Control
PSC Subjective Note · Nepal Engineering Service (Civil), Second Paper · Lok Sewa Aayog
Soil Compaction
Compaction: Compaction is a process of pressing soil particles close to each other by mechanical methods. In compaction, air is expelled from the void space in the soil mass and thus the dry density of the soil is increased.
In other words, compaction is the densification of soil by removal of air, which requires mechanical energy.
Purpose of Soil Compaction
- To increase the dry density of the soil.
- To improve the engineering properties of the soil such as shear strength, stability and bearing capacity.
- To decrease the undesirable settlement of structures.
- To control undesirable volume changes (swelling and shrinkage).
Key Point: Compaction removes air, not water. It is a rapid, artificial process carried out by mechanical means such as rolling, tamping and vibration.
Dry Density and Water Content Relationship
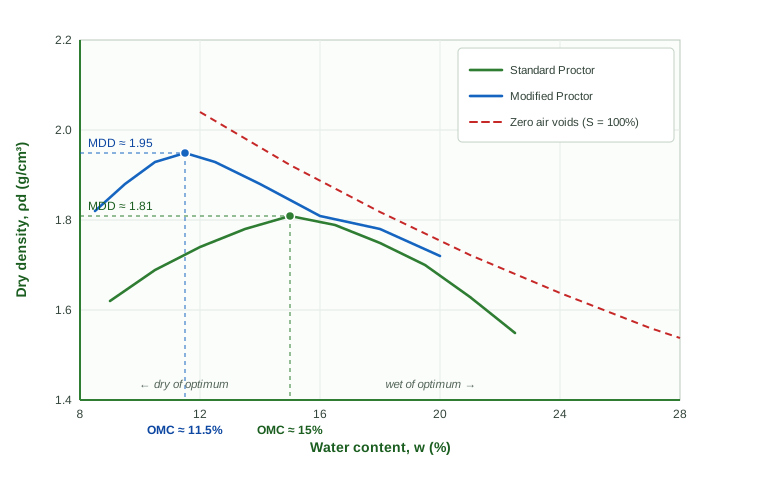
For any soil there exists a definite relationship between the soil water content and the dry density to which the soil can be compacted. For a specific amount of compaction energy or effort applied on the soil, there is a particular water content at which the soil attains its maximum dry density.
Optimum Moisture Content (O.M.C.) / Optimum Water Content (O.W.C.): The water content corresponding to the maximum dry density is known as the Optimum Moisture Content or Optimum Water Content.
At Water Content Lower Than the Optimum
At a water content lower than the optimum, the soil is rather stiff and has a lot of void spaces, and therefore the dry density is low.
As Water Content Is Increased
As the water content is increased, the soil particles get lubricated and slip over each other, and move into densely packed positions, so the dry density is increased.
At Water Content More Than the Optimum
However, at a water content more than the optimum, the additional water reduces the dry density, as it occupies the space that might have been occupied by solid particles.
Compaction Curve: The curve between water content and dry density is known as the water content–dry density curve, the moisture content–dry density curve, or simply the compaction curve.
Laboratory Test to Obtain Compaction Characteristics
- Standard Proctor Test
- Modified Proctor Test
Standard Proctor Test
Procedure
- 2.5 kg of air-dried soil passing through a 4.75 mm sieve is taken.
- Water is added to the soil (about 4% for coarse-grained soil and 8% for fine-grained soil) such that the water content is less than the expected optimum moisture content.
- The mass of the mould with base plate but without collar is taken (M1). The collar is fitted and the soil is placed in the mould to about one-third of its height.
- The soil is compacted using a 2.5 kg rammer falling through a height of 310 mm, in 25 blows, evenly distributed over the surface.
- Similarly, the second and third layers of soil are filled and compacted. (Total 3 layers.)
- The collar is removed and the soil above the mould is trimmed off.
- The mass of the mould with base plate and compacted soil is taken (M2), so the mass of compacted soil = M2 − M1.
- Bulk density and dry density are computed as given below, and the water content is obtained by the oven-drying method.
- Again, some more water is added to increase the water content by 2–3% and the test is repeated.
- The dry density is plotted against water content, and the OMC and maximum dry density are determined.
Calculations
Where V = volume of the mould = (π d2 / 4) × H, with d = internal diameter of the mould and H = height of the mould.
Where w = water content obtained from the oven-drying method.
| Soil type | Water content |
|---|---|
| Sand | 6 to 10% |
| Sandy silt or silty sand | 8 to 12% |
| Silt | 12 to 16% |
| Clay | 14 to 20% |
Modified Proctor Test
- It is the method developed during the Second World War due to the requirement of higher subgrade resistance of pavements.
- In this method the same mould as in the standard Proctor test is used, but the compaction effort is increased by using a 4.5 kg rammer falling through a height of 450 mm.
- The compaction of soil is done in 5 layers, with each layer receiving 25 blows of the rammer.
Comparison: Standard Proctor vs Modified Proctor
| Parameter | Standard Proctor | Modified Proctor |
|---|---|---|
| Mass of rammer | 2.5 kg | 4.5 kg |
| Height of fall | 310 mm | 450 mm |
| Number of layers | 3 | 5 |
| Blows per layer | 25 | 25 |
| Compactive effort | Lower | Higher (about 4.5 times) |
| Maximum dry density | Lower | Higher |
| Optimum moisture content | Higher | Lower |
| Typical use | Embankments, fills, general earthwork | Pavement subgrade, airfield and highway works |
Exam Tip: A numerical question usually gives the mould mass, volume (or diameter and height), the mass of mould + wet soil and the water content. Compute ρ, then ρd, repeat for each observation, and plot ρd vs w to read the OMC and maximum dry density.
Factors Affecting Compaction
- Water content
- Amount of compaction (compactive effort)
- Type of soil
- Method of compaction
- Admixtures
1. Water Content
- Initially ρd increases with increase in water content due to the lubricating effect, which results in easier compaction.
- However, at a water content more than the optimum, the additional water reduces the dry density, as it occupies the space that might have been occupied by solid particles.
2. Amount of Compaction
- The effect of increasing the amount of compactive effort is to increase the maximum dry density and to decrease the optimum water content.
- At a water content less than the optimum, the effect of increased compaction is more predominant.
- At a water content more than the OMC, the volume of air voids becomes almost constant and the effect of increased compaction is not significant.
3. Type of Soil
- Coarse-grained soils can be compacted to a higher dry density than fine-grained soils. With the addition of even a small quantity of fines to a coarse-grained soil, the soil attains a much higher dry density for the same compactive effort. But when fines are excessive, the dry density decreases.
- Well-graded sand attains a much higher dry density than a poorly graded soil.
- Cohesive soils attain a relatively lower maximum dry density as compared to cohesionless soils due to high air voids.
- Clays of high plasticity have very low dry density and a very high OMC.
4. Method of Compaction
- The dry density achieved depends not only upon the amount of compactive effort but also on the method of compaction.
- For the same amount of compactive effort, the dry density will depend upon whether the method of compaction utilises kneading action, dynamic action or static action.
5. Admixtures
- The compaction characteristics of soils are improved by adding other materials, known as admixtures.
- The most commonly used admixtures are lime, cement and bitumen.
Effect of Compaction on Engineering Properties
The water content of a compacted soil is expressed with reference to the OMC. Thus, soils are said to be compacted dry of optimum or wet of optimum (i.e. on the dry side or wet side of OMC). The structure of a compacted soil is not similar on both sides even when the dry density is the same, and this difference has a strong influence on the engineering characteristics, namely:
- Soil structure
- Permeability
- Compressibility
- Pore water pressure
- Swelling
- Shrinkage
- Stress–strain relationship
Soil Structure
For a given compactive effort, soils have a flocculated structure on the dry side (i.e. soil particles are oriented randomly), whereas they have a dispersed structure on the wet side (i.e. particles are more oriented in a parallel arrangement perpendicular to the direction of applied stress). This is due to the well-developed adsorbed water layer (water film) surrounding each particle on the wet side.
Permeability
The randomly oriented soil on the dry side exhibits the same permeability in all directions, whereas the dispersed soil on the wet side is more permeable along particle orientation than across particle orientation.
Compressibility
The flocculated structure developed on the dry side of the optimum offers greater resistance to compression than the dispersed structure on the wet side. Thus, the soils on the dry side are less compressible.
Pore Water Pressure
A sample compacted dry of the optimum has a low water content. The pore water pressure for the soil compacted dry of the optimum is therefore less than that for the same soil compacted wet of the optimum.
Swelling
Due to a higher water deficiency and partially developed water films on the dry side, when given access to water the soil will soak in much more water and then swell more.
Shrinkage
During drying, soils compacted on the wet side tend to show more shrinkage than those compacted on the dry side. On the wet side, the more orderly orientation of particles allows them to pack more efficiently.
Stress–Strain Relationship
The soils compacted dry of optimum have a steeper stress–strain curve than those on the wet side. The modulus of elasticity for soils compacted dry of the optimum is therefore high. Such soils have brittle failure.
The soils compacted wet of the optimum have a relatively flatter stress–strain curve and a corresponding lower value of modulus of elasticity. The failure in this case occurs at a large strain and is of plastic type.
| Property | Dry of optimum | Wet of optimum |
|---|---|---|
| Structure | Flocculated, random orientation | Dispersed, parallel orientation |
| Permeability | Same in all directions | Higher along particle orientation |
| Compressibility | Less | More |
| Pore water pressure | Less | More |
| Swelling | More | Less |
| Shrinkage | Less | More |
| Stress–strain curve | Steeper, high modulus, brittle failure | Flatter, low modulus, plastic failure |
Method of Compaction
Compaction methods in the field depend upon soil types, the maximum dry density required and economic considerations. Commonly used compaction methods are:
- Tampers
- Rollers
- Smooth wheeled rollers
- Pneumatic tyred rollers
- Sheep-footed rollers
- Grid rollers
- Vibrating plates
The compaction achieved will depend on the thickness of the lift (or layer), the type of roller, the number of passes of the roller and the intensity of pressure on the soil.
Suitability of Compaction Equipment
| Equipment | Most suitable soils | Least suitable soils |
|---|---|---|
| Smooth steel drum rollers (static or vibratory) | Well-graded sand–gravel, crushed rock, asphalt | Uniform sands, silty sands, soft clays |
| Pneumatic tyred rollers | Most coarse and fine soils | Very soft clays |
| Sheepsfoot rollers | Fine grained soils, sands and gravels with > 20% fines | Uniform gravels, very coarse soils |
| Grid rollers | Weathered rock, well-graded coarse soils | Uniform materials, silty clays, clays |
| Vibrating plates | Coarse soils with 4 to 8% fines | — |
| Tampers and rammers | All soil types | — |
Zero-Air-Void Line (ZAV Line)
Dry density can be related to water content and degree of saturation (S) as:
Thus, it can be visualised that an increase of dry density means a decrease of void ratio and a more compact soil.
Similarly, dry density can be related to percentage air voids (na) as:
Zero-air-void line: The relation between moisture content and dry unit weight for a saturated soil (S = 100%) is the zero air-voids line. For S = 100%, ρd = G ρw / (1 + w · G).
It is not feasible to expel air completely by compaction, no matter how much compactive effort is used and in whatever manner. Hence the compaction curve always lies to the left of (below) the zero air-voids line.
Compaction Control at Field
The laboratory compaction tests give the optimum water content and the maximum dry density. In the field, during the compaction of soils, it is essential to check the dry density and the water content in order to effect proper quality control. Compaction control is therefore done by measuring the dry density and the water content of the compacted soil in the field.
Determination of Dry Density
- Sand replacement method – suitable for cohesionless, firm, gravelly soil.
- Core-cutter method – suitable for loose cohesive soil.
Determination of Water Content
- The oven-drying method of determination of the water content takes 24 hours.
- The water content can be determined indirectly using a Proctor needle, also known as a plasticity needle.
Proctor Needle (Plasticity Needle)
- The Proctor needle consists of a rod attached to a spring-loaded plunger. The stem of the plunger is marked to read the resistance in Newton.
- The needle-shank has graduations to indicate the depth of penetration.
- For cohesive soil, needle points of larger cross-sectional area are required, and for cohesionless soil, those of smaller cross-sectional areas are used.
- After the soil has been compacted at a given water content in the compaction test in the laboratory, a suitable needle point is forced into the soil mass by the rod to a depth of 7.5 cm at the rate of 1.25 cm/sec.
- The maximum force used to penetrate the needle is read out of the scale. This force, when divided by the needle (tip) area, gives the penetration resistance.
- A number of such measurements are made in the laboratory during the compaction test, and a calibration curve is obtained between the penetration resistance (R) and the water content.
- To determine the water content of the compacted soil in the field, the soil is compacted in the standard compaction mould in the field and the penetration resistance of the compacted soil is measured.
- The moisture content is then obtained from the calibration curve.
Relative Compaction / Percent Compaction
The dry density achieved in the field is compared with the maximum dry density obtained in the standard Proctor test or that in the modified Proctor test. The ratio of the dry density in the field to the maximum dry density in the laboratory is known as the relative compaction or percent compaction.
Relative compaction (%) = (ρd,field / ρd,max(lab)) × 100
Typical Values Achievable in the Field
- For cohesive soils, a dry density of the order of 95% of the maximum dry density of the standard Proctor test can be achieved using a sheep-foot roller or a pneumatic-tyred roller.
- For moderately cohesive soils, a dry density of the order of 95% of that in the modified Proctor test can be achieved using a pneumatic-tyred roller with an inflation pressure of 600 kN/m2.
- For very heavy clay, sheep-foot rollers are effective.
- For cohesionless soils, a dry density of the order of 100% or even more of that in the modified Proctor test can be obtained using pneumatic-tyred rollers, vibratory rollers and other vibratory equipment.
Compaction Specification
- End-product specification: Relative compaction or percentage compaction is specified.
- Method specification:
- Type and weight of roller.
- The number of passes.
- Suitable for large projects only.
Compaction and Consolidation
| Compaction | Consolidation |
|---|---|
| Volume reduces for partially saturated soil due to expulsion of air without altering the water content. | Reduction in volume of soil (saturated) by squeezing out of water. |
| It is a rapid process by mechanical means such as rolling, tamping and vibration. | It is a gradual process under sustained static loading. |
| It is an artificial process. | It is a natural process with progress of time. |
| Compaction is carried out at an optimum water content. | Consolidation occurs in saturated soil and is time dependent. |
Summary
Key Points to Remember
- Compaction = densification of soil by removal of air, using mechanical energy.
- Purpose: increase dry density, improve shear strength/stability/bearing capacity, reduce settlement, control volume changes.
- OMC is the water content at which the maximum dry density is obtained for a given compactive effort.
- Standard Proctor: 2.5 kg rammer, 310 mm fall, 3 layers × 25 blows.
- Modified Proctor: 4.5 kg rammer, 450 mm fall, 5 layers × 25 blows.
- More compactive effort → higher maximum dry density and lower OMC.
- Dry of optimum: flocculated, less compressible, more swelling, brittle failure.
- Wet of optimum: dispersed, more shrinkage, plastic failure.
- Compaction curve always lies left of the zero air-voids line.
- Field density: sand replacement and core-cutter methods; water content: oven drying or Proctor needle.
For Exams:
- Define compaction before writing its purpose.
- Always draw the compaction curve and mark OMC, MDD and the ZAV line.
- Write the test data (mass of rammer, height of fall, layers, blows) in a compact table.
- Use numbered headings for factors and effects; one line each is enough for short marks.
Long / Descriptive Questions and Answers
Define Compaction and State Its Purpose (5)
Compaction is a process of pressing soil particles close to each other by mechanical methods. In compaction, air is expelled from the void space in the soil mass and thus the dry density of the soil is increased. In other words, compaction is the densification of soil by removal of air, which requires mechanical energy.
Purpose:
- To increase the dry density of soil.
- To improve engineering properties such as shear strength, stability and bearing capacity.
- To decrease the undesirable settlement of structures.
- To control undesirable volume changes.
Explain the Dry Density and Water Content Relationship with a Neat Sketch (5)
For any soil there exists a definite relationship between water content and dry density, and for a specific compactive effort there is a particular water content at which the soil attains its maximum dry density; this is the optimum moisture content (OMC).
- At water content lower than the optimum, the soil is stiff, has many void spaces, and the dry density is low.
- As water content is increased, the soil particles are lubricated and slip into densely packed positions, increasing the dry density.
- At water content more than the optimum, additional water occupies the space that might have been occupied by solid particles, reducing the dry density.
The curve so obtained is the compaction curve (water content–dry density curve); its peak gives the MDD and the corresponding water content is the OMC.
Describe the Standard Proctor Test with Procedure and Calculations (10)
- Take 2.5 kg of air-dried soil passing through a 4.75 mm sieve.
- Add water (about 4% for coarse-grained and 8% for fine-grained soil) so that the water content is below the expected OMC.
- Take the mass of the mould with base plate but without collar, M1.
- Fit the collar, place soil in about one-third of the mould, and compact with a 2.5 kg rammer falling 310 mm, in 25 blows evenly distributed.
- Repeat for the second and third layers (3 layers in total).
- Remove the collar, trim off surplus soil, and take the mass M2.
- Compute bulk density ρ = (M2 − M1)/V, with V = (πd2/4)×H, and dry density ρd = ρ/(1 + w).
- Increase water content by 2–3% and repeat; plot ρd vs w to obtain the OMC and MDD.
Discuss the Factors Affecting Compaction (5) or (10)
- Water content: dry density increases up to the OMC due to lubrication and decreases beyond it as water occupies space.
- Amount of compaction: increasing compactive effort increases MDD and decreases OMC; the effect is predominant on the dry side.
- Type of soil: coarse-grained and well-graded soils attain higher dry density; high-plasticity clays have low dry density and high OMC.
- Method of compaction: for the same effort, the result depends on whether kneading, dynamic or static action is used.
- Admixtures: lime, cement and bitumen improve compaction characteristics.
Explain the Effect of Compaction on Engineering Properties (10)
Compacted soils are described as dry of optimum or wet of optimum. Even at the same dry density, the structure differs and strongly influences engineering behaviour.
- Soil structure: flocculated (random) on the dry side, dispersed (parallel) on the wet side.
- Permeability: isotropic on the dry side; on the wet side higher along particle orientation.
- Compressibility: dry side is less compressible.
- Pore water pressure: lower for the dry side due to lower water content.
- Swelling: greater on the dry side because of water deficiency and partially developed water films.
- Shrinkage: greater on the wet side due to orderly particle packing.
- Stress–strain: steeper curve, higher modulus and brittle failure on the dry side; flatter curve, lower modulus and plastic failure on the wet side.
Differentiate between Compaction and Consolidation (5)
| Compaction | Consolidation |
|---|---|
| Volume reduction of partially saturated soil by expulsion of air, without altering water content. | Volume reduction of saturated soil by squeezing out water. |
| Rapid process by mechanical means (rolling, tamping, vibration). | Gradual process under sustained static loading. |
| Artificial process. | Natural process, progressing with time. |
Explain Compaction Control at Field (5)
- Laboratory tests give OMC and MDD; field work must be checked for dry density and water content.
- Dry density – sand replacement method (cohesionless, firm, gravelly soil) and core-cutter method (loose cohesive soil).
- Water content – oven-drying (24 hours) or the Proctor/plasticity needle, where penetration resistance is calibrated against water content in the laboratory.
- The field dry density is compared with the laboratory MDD as relative compaction (percent compaction), typically 95% or more depending on soil and equipment.
Related note: For shear strength parameters, failure criteria, Mohr's circle and the direct shear, triaxial and unconfined compression tests, read Soil Mechanics – Shear Strength of Soil.